Application Dashboard
Application Dashboard displays the summary / grouped report of all the issues and metrics in the application -
-
Navigate to
IZ Eyeand select any application type. Eg: Mule Projects or APIs -
Click on the
View Dashboardaction of any of the applications -
Dashboard is group by -
-
Application Statistics- Displays all the issues grouped by rule severity and category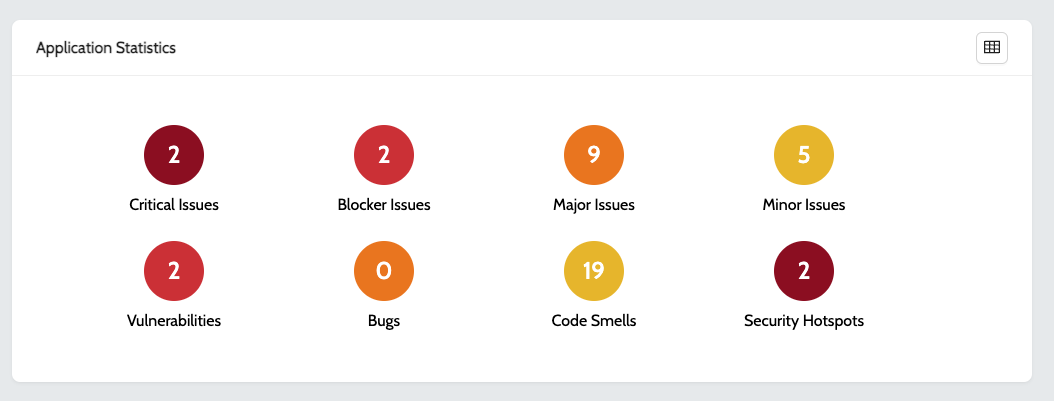
-
Summary Metrics- Displays all the aggregated metrics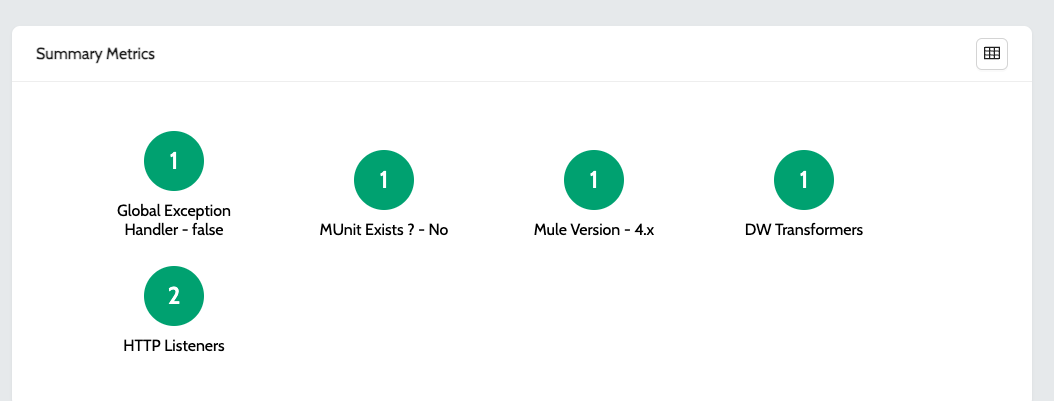
-
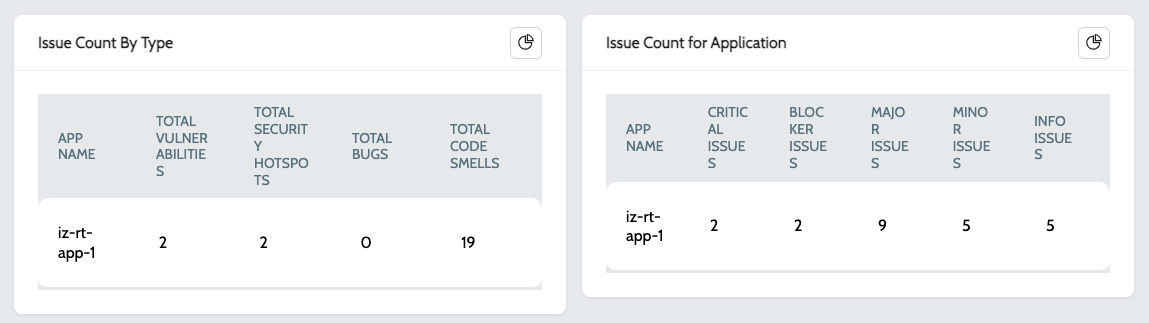
Issue Count By Type- Displays the graphical view of count of issues by type and category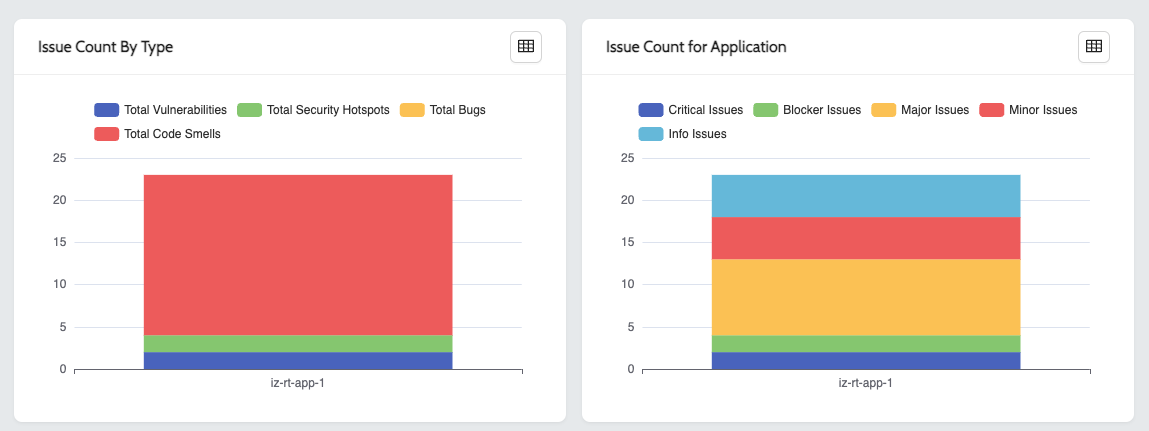
-
-
To get the tabular view of all the available charts, click on the
table viewicon available on the top right of every chart